If you’re going to start trading Forex, you need to understand Forex charts. There are different types of charts that your broker may use: line, bar, and candlestick charts.
There are many other types, but these three are the most popular. Every chart has its benefits and downsides.
In this article, we’ll explain how to read them, as well as what each of these is best for. To trade forex, you should find a reputable forex broker with minimum spreads.
What are Forex Charts?
Price charts aggregate the buy and sell prices of all currency pairs across platforms to generate price information. They provide visual descriptions of the change in the difference between currency pairs. They plot the values of the currency vertically (y-axis) and time horizontally (x-axis).
Computer-generated price charts can be changed to highlight the movement of a currency pair over different time intervals: weeks, months, or years.
By reading price charts, traders can see a visual representation of the movements and trends of various currency pairs.
Line Charts

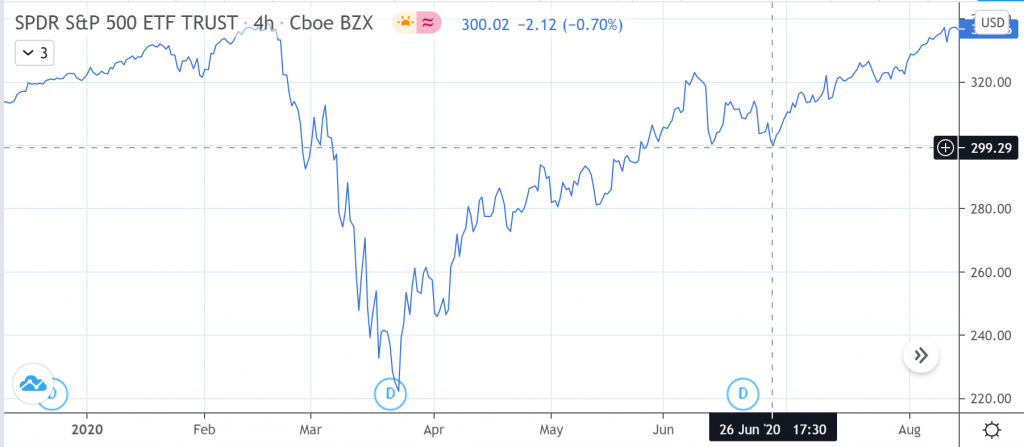
Line charts are the most visually and informationally basic price charts that traders use.
They represent the closing price of a currency pair over time with a single, unbroken line. The value of the y-axis goes up or down depending on the change in the difference between the value of the currencies that make up a particular pair.
They are helpful for traders because they condense lots of important information into an easily digested illustration. Traders can take a quick look at a line chart to get an overall idea of a pair’s trends and movements.
They are limited in the amount of information that they show. Unlike bar or candlestick, line charts only really show the reader two key aspects of a currency pair’s performance.
Bar Charts

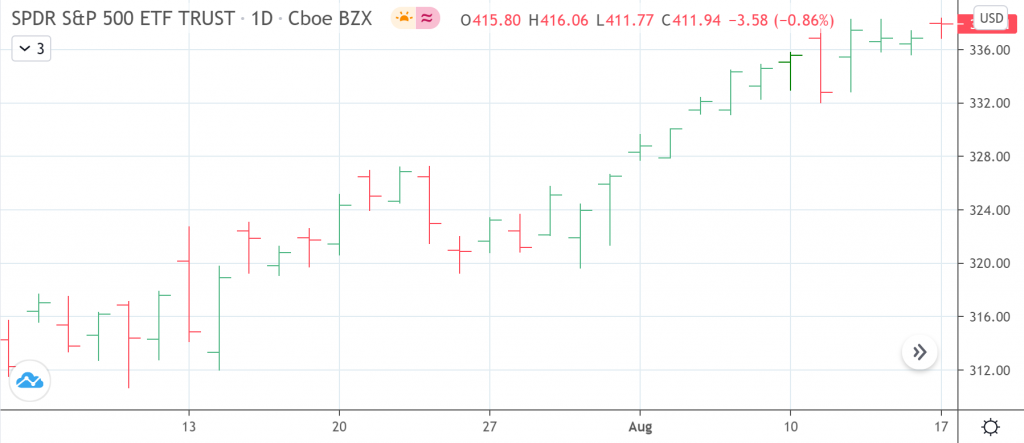
Bar charts are somewhat confusingly named. They are drawn as a more informative line chart, rather than the kinds you got used to in school or college.
In a bar chart, a new vertical bar is drawn for every trading day. Each bar has two appendages detailing the open and close prices of the currency pair.
The top of each bar indicates that pair’s high for the day. The bottom of each bar shows the pair’s low.
They are useful for traders who are looking for more information on the day-by-day performance of any currency pair. Like line charts, they can convey important information at a glance.
Bar charts have the bonus of detailing how the pair changed during the trading day. This is useful for day traders who use strategies like swing trading to maximize profit on short-term trades.
Candlestick Charts

Most brokers will, by default, provide all prices as candlestick charts. They are the most popular choice for price graphing among Forex traders.
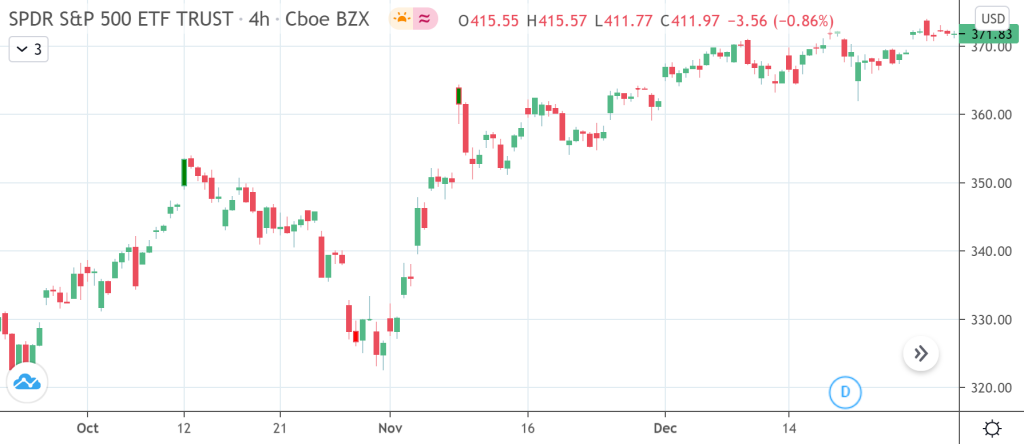
Candlestick charts show high and low point information on a currency pair as well as its opening and closing position.
Many people prefer candlesticks to bar charts because the information is presented more neatly and is quicker to read. They use a vertical line to represent the high and low points of a currency pair. A colored body is used to show the open and close positions. This gives the graph its name: the rectangular body with a line running from the top appears like a candle with a wick.
Candlestick charts have some advantages over bar charts. If a pair closes at a position that was lower than where it started, candlestick graphs have a way of neatly conveying that information.
Graphers color the “body” of the candlestick, often either black or red, depending on how the pair moved throughout the day. For example, if EUR/CAD closed on a low, the body would be colored red. If it closed high, the body would be green.
Reading the Charts
Scanning charts will make the world of difference to any potential Forex traders. It’s crucial that, when you open a trade, you have some idea of which direction a currency pair is going to trend.
You don’t want to take random trades and hope it works out for the best.
So before you open a Forex trade, look at graphs that show the movement of various currency pairs.
Depending on the strategy you plan on using, some graphs will be better than others. If you plan on keeping your position for days, weeks, or months, then all of the information you will need will be in a line chart.
If you want to use strategies like swing trading or scalping, then you need graphs with more information. Some people may use candlestick charts to show them the volatile movements of a currency pair. Others might choose a bar chart to earn off of small price changes.
Conclusion
Traders should dedicate time and effort to ensuring that they are experts in reading and predicting the movements of all sorts of charting tools.
Although each type was presented here with benefits and flaws, the most effective Forex traders use a combination of many types to give themselves the best and most current information about a currency.
There are also plenty of extra add-ons and tools that brokers use to make their price charts more engaging or customizable. Look at what charting software your broker uses and decide what the best strategy to use with them is.
With a little bit of practice, and a lot of luck, you can take what you’ve learned and turn them into a real profit.


